Innovative Volatility-Targeting Strategies for Lifetime Pension Pools
By Jean-François Bégin and Barbara Sanders
Risks & Rewards, September 2024

Lifetime pension pools—also referred to as variable payment life annuities, dynamic pension pools, and retirement tontines—enable retirees to transform a lump sum into lifelong income. Individuals contribute a sum of money to the pool, which then provides them with regular payments for the duration of their lives. This arrangement is intended to alleviate pool members’ concerns of outliving their savings, a significant risk for those managing their retirement assets through an income drawdown fund.
The term pool in this context signifies a risk-sharing arrangement among members rather than a risk transfer to an external entity. Consequently, the pool cannot guarantee a fixed income level, and benefit payouts must be periodically adjusted based on the group’s experience. This is typically achieved by multiplying the current benefit payout by two experience adjustment factors: The mortality experience adjustment factor and the investment experience adjustment factor (see Figure 1 ):
Figure1
Typical Benefit Update Rule
The mortality experience adjustment (MEA) factor (green box in Figure 1) reflects the actual mortality experience of the pool compared to the mortality assumptions used to convert the lump sum into an initial benefit payout.[1] Usually, this adjustment factor will exceed one—indicating an increase in benefit levels—if the number of survivors is lower than anticipated by the mortality table. Conversely, if members experience lower mortality than expected, the adjustment factor will fall below one, reducing all survivors’ benefits to ensure the sustainability of lifetime payouts.
The investment experience adjustment (IEA) factor (blue box in Figure 1) adjusts for differences between actual investment returns and the assumed interest rate—or hurdle rate—used to convert the lump sum into an initial benefit payout. Specifically, this adjustment factor will be greater than one if the actual investment return exceeds the hurdle rate, and it will be less than one if the investment return falls short of the hurdle rate.
These adjustment factors change over time, leading to volatility in benefit payouts (defined as the standard deviation of the benefit payouts in the next period). This volatility is one of the primary concerns for participants in lifetime pension pools. Three factors affect volatility: The pool composition, market conditions and the asset allocation. The pool operator chooses the asset allocation but has no control over the other two factors.
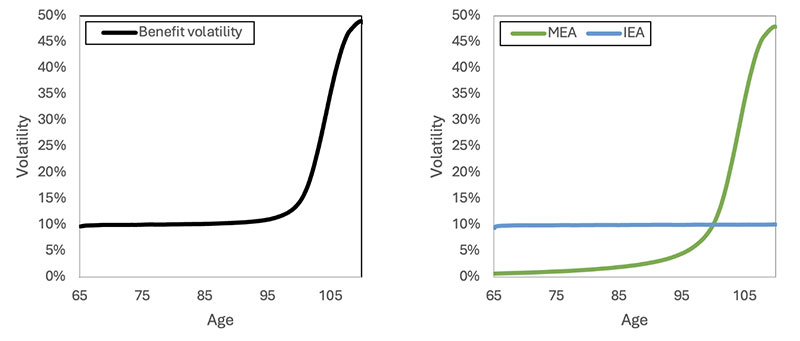
- The pool composition: The number of pool members and their age impact benefit volatility. To illustrate this concept, Figure 2 considers a closed pool that starts off with 1,000 members, all aged 65, who invest in a hypothetical, simplified portfolio that comprises two assets—risky and risk-free—such that the unconditional volatility of the investment portfolio is close to 10%. For simplicity, the risk-free asset is represented by a money market account, while the risky asset is represented by a total equity market index (proxied by the S&P 500 index in this study).[2] Initially, the volatility remains close to 10%—during these years investment performance is the primary driver of benefit changes. However, approximately 30 years after inception, the benefit volatility due to mortality experience rises sharply. This increase occurs as the pool size diminishes and the survival probability of the remaining members decreases.
- Market conditions: Some years are more volatile than others—a by-product of volatility clustering. For instance, market volatility has been notably higher in 2007–2008 (the Global Financial Crisis), in 2011 (the European debt crisis), in 2020 (the COVID-19 pandemic), and in 2022 (the Russia–Ukraine conflict). Thus, the volatility of the investment experience adjustment varies based on current market conditions—increasing during times of market turmoil and decreasing during periods of stability.
Figure 2
Volatility of Benefit Adjustments and its Constituents for a Static Allocation in the Risky Asset
Traditional approaches to managing benefit volatility in lifetime pension pools often rely on delayed recognition of gains and losses that address fluctuations after they occur. For instance, the pool operator could temporarily ignore some of the adjustments to stabilize the benefits. This can potentially help with benefit volatility but can also introduce generational inequities between cohorts of members, increase the potential for shortfall (i.e., risk of insufficient assets to pay future benefits), and impact the pool’s ability to attract new members (for more details on delay mechanisms in the context of lifetime pension pools, see Section 6 of Bégin and Sanders, 2023).
Volatility Targeting as a Risk Management Tool
A more proactive alternative involves addressing benefit volatility through tactical investment strategies—by creating a more resilient and adaptive investment approach that can respond to both changing market conditions and pool composition. Volatility targeting operates by dynamically adjusting the portfolio’s risk exposure based on the current level of market volatility. By defining a risk tolerance in terms of a targeted volatility level, the pool operator can tailor the pool’s investment strategies to maintain benefit stability before fluctuations occur. This method pre-emptively manages risk and aligns the investment strategy with the pool’s risk tolerance by modifying the pool’s exposure to the risky asset.
As stated earlier, the pool composition and market conditions primarily influence the changes in benefit level. Adjusting the allocation to the risky asset can alter the overall benefit volatility, aligning it more closely with the pool’s risk tolerance.
- The pool composition: Reducing the allocation to the risky asset when the pool has fewer, older members can help achieve stable benefits. Conversely, the allocation could be higher when the pool has many, younger members.
- Market conditions: When market volatility is expected to be high, a pool operator who wants to keep the benefit volatility constant and stable over time should decrease the allocation to the risky asset, thus reducing the impact of investment risk on the benefit adjustment. When market volatility is low, on the other hand, the allocation to the risky asset can be increased, thereby enhancing the potential for higher returns by boosting the pool’s exposure to the asset.
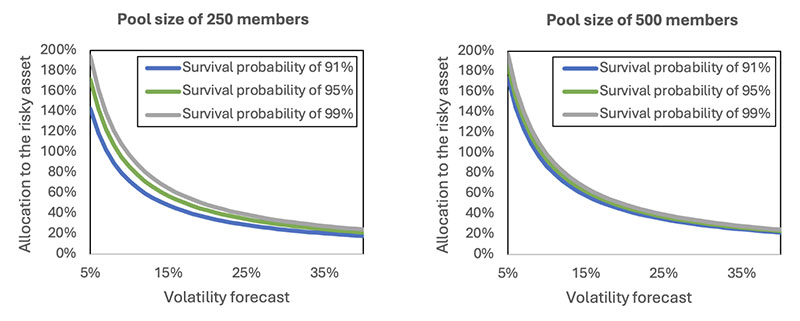
The literature has argued over the past 20 years that volatility-targeting strategies can potentially enhance portfolio returns by increasing the average return and reducing downside risk due to the well-documented negative relationship between returns and volatility (i.e., the leverage effect). Simply put, when volatility increases, future returns on the risky asset are expected to be negative, justifying a smaller allocation to it. Conversely, when volatility decreases, returns are expected to be positive, making it advantageous to invest more aggressively in the risky asset (see Figure 3).
Figure 3
Risky Asset Allocation as a Function of the Volatility Forecast, Pool Size and Survival Probability
Implementation of the Strategy
Effective volatility targeting requires accurate prediction of future volatility in the near term. In practice, the pool operator is not privy to the true data generating process and needs to devise practical means to estimate the benefit volatility via coarse assumptions and proxies. On the mortality side, it is assumed that the pool operator has access to a static mortality table that incorporates all historical information; however, the future number of pool members remains random. On the investment side, volatility of the risky asset over the next period is forecasted using a nonparametric heterogeneous autoregressive model based on realized volatility (i.e., the sum of squared intraday high-frequency returns taken over a day, typically observed every five minutes), similar to the model put forward by Corsi (2009).[3]
By using the pool operator’s proxies, a formula can be derived to determine an asset allocation strategy that ensures the estimated volatility of the total benefit adjustment in the next period (i.e., the pool operator’s volatility forecast) matches the targeted overall volatility level. Figure 3 illustrates the impact of the volatility forecast, pool size, and anticipated survival probability on the allocation to the risky asset when the volatility target is fixed at 10%. As expected, the allocation increases when the pool operator’s volatility forecast is lower. The pool size also affects the allocation, especially when the survival probability is lower: When individual mortality risk is high, diversifying that risk across a large pool of members is even more powerful, which in turn leaves more room for investing in the risky asset while still meeting the overall volatility target.
Comparison with Static Allocation
Again, the analysis considers a closed pool of 1,000 members, all aged 65, to compare the volatility-targeting strategy described earlier to a static allocation strategy. Each member deposits a $1,000,000 lump sum to the pool, leading to an initial benefit of about $106,000 per annum; under the static allocation strategy, the allocation is rebalanced every month, and benefits are paid at a monthly frequency. The volatility target is set at 10%, and the static allocation strategy is set such that the unconditional volatility of the investment portfolio at inception is close to 10%. These results are obtained via Monte Carlo simulation based on 100,000 mortality and investment scenarios.
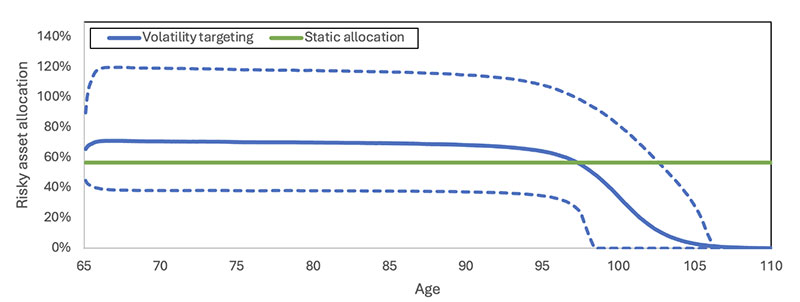
Figure 4
Risky Asset Allocation Funnel of Doubt for Volatility-targeting and Static Allocation Strategies
Figure 4 illustrates the funnels of doubt of the proportion of the pool’s assets invested in the risky asset for both the volatility-targeting and static allocation strategies, including average values (solid lines) and the 5th and 95th percentiles (dashed lines).[4] The static allocation results in a constant weight of 56.8% across all scenarios. In contrast, the volatility-targeting strategy shows some variability: On average, the volatility-targeting strategy allocates more to the risky asset than the static strategy during the first 30 years (69.7% versus 56.8%), leading to higher average returns. During this period, there is considerable variation in the allocation: The 5th and 95th percentiles range from 38.1% to 116.8%, respectively. After the initial 30 years, the average allocation of the volatility-targeting strategy decreases due to increased risk in the MEA. The funnel of doubt narrows around the mean value, ultimately reaching a risky asset allocation of zero in all scenarios.
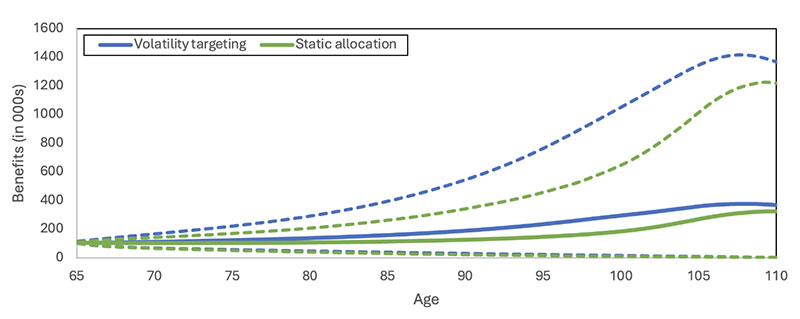
Figure 5 presents the funnels of doubt of the annualized benefit payments for both the volatility-targeting and the static allocation strategies. Consistent with the higher average risky asset allocation when using the volatility-targeting strategy in Figure 4, the average benefit is higher than that of the static strategy. The volatility-targeting strategy’s average benefit increases for the first 30 to 35 years. Additionally, the fifth and 95th percentiles of the benefit distribution for the volatility-targeting strategy consistently exceed those of the static strategy, resulting in generally superior benefits. This outcome is a direct consequence of the strategy’s design, which involves reducing the allocation to the risky asset during periods of heightened volatility. This approach lowers the likelihood of significant benefit reductions and improves the left tail of the benefit distribution.
Figure 5
Benefits Funnel of Doubt for Volatility-targeting and Static Allocation Strategies
Table 1 complements the results of Figure 5 by offering a detailed view of the benefit distribution for specific ages. Across all ages, the benefits derived from the volatility-targeting strategy predominantly outperform those of static allocations. For instance, at age 75, volatility targeting yields larger benefits in 88.2% of the scenarios. This trend continues, with 95.0% at age 85 and 97.5% at age 95 (see row ‘Proportion (%)’ in Table 1, showing the proportion of scenarios in which one of the two strategies leads to higher benefits than the other strategy).
Table 1
Summary Statistics of Benefits
Table 2 provides insights into the monthly benefit adjustments. During the initial 30 years, both the average and median benefit adjustments are notably higher for the volatility-targeting strategy, contributing to the steady increase in average benefits observed in Figure 5. Overall, the volatility-targeting strategy exhibits more favorable adjustments compared to the static approach. However, beyond the initial 30 years, the volatility-targeting strategy tends to yield lower average adjustments compared to the static approach, trading this off for a thinner left tail of the adjustment distribution (as shown at the fifth percentile). This demonstrates that the volatility-targeting approach effectively reduces the likelihood of drastic benefit decreases.
Table 2
Summary Statistics of Benefit Adjustments
Overall, the results indicate that the volatility-targeting approach yields more secure benefits than the static allocation strategy with greater upside potential, demonstrating its effectiveness and robustness.
Limitations in Practical Situations
While the volatility-targeting strategy considered above provides compelling results, its application in real-world scenarios can encounter significant limitations. Various factors, such as leverage constraints, brokerage fees, and rebalancing frequencies, can impede the seamless implementation of the strategy. These factors have been considered and are summarized below.
- Leverage constraints: Leverage allows the pool to fully capitalize on low-volatility periods by increasing the risky asset allocation. Yet, even with leverage constraints, the strategy’s overall effectiveness remains robust compared to traditional static allocation methods.
- Brokerage fees: Even with the inclusion of brokerage fees, the volatility-targeting strategy continues to outperform traditional strategies by reducing downside risk and increasing upside potential, despite the generally higher overall fees due to increased turnover.
- Rebalancing frequencies: More frequent rebalancing leads to better adherence to the targeted volatility levels. However, the volatility-targeting strategy’s overall performance remains robust even with less frequent rebalancing. Also, while frequent rebalancing incurs higher transaction costs, the volatility targeting strategy still outperforms the traditional static allocation.
Other Active Allocation Strategies
Tactical and other active allocation strategies entail leveraging the insights of experts to actively buy and sell assets with particular characteristics. While volatility-targeting is one such strategy, it is not the only option available to pool operators. For example, trend following involves identifying long-term trends and making investment decisions based on the market direction. Further research is needed to explore other intelligent portfolio construction techniques as to their application to lifetime pension pools.
Further Reading
The literature on volatility targeting goes back more than two decades and is positive. For those interested in learning more about this concept, the work of Harvey et al. (2018) is recommended. For a more detailed analysis of volatility-targeting in the context of lifetime pension pools, Olivieri et al. (2022), Li et al. (2022), and the authors’ recent open-access article on this topic are recommended.
Acknowledgements
This research has been funded by the Canadian Institute of Actuaries. The authors would also like to thank David Cantor for suggestions and comments on an early version of this article.
Statements of fact and opinions expressed herein are those of the individual authors and are not necessarily those of the Canadian Institute of Actuaries, Society of Actuaries, the respective authors’ employers, or the newsletter editors.
Jean-François Bégin, FSA, FCIA, PhD, is an Associate Professor at Simon Fraser University. He is based in Vancouver, Canada. He can be reached at jbegin@sfu.ca.
Barbara Sanders, FSA, FCIA, MSc, is an Associate Professor at Simon Fraser University. She is based in Vancouver, Canada. She can be reached at bsanders@sfu.ca.
Endnotes
[1] The initial benefit payout level is determined by dividing the amount invested by a participant by an annuity factor. This annuity factor uses the hurdle rate and some initial mortality assumption that is representative of the mortality experience of the pool. For more details on this calculation, see Piggott et al. (2005), Qiao and Sherris (2011), and Bégin and Sanders (2024).
[2] For simplicity’s sake, we assume that the pool can invest in two assets: a risk-free asset—the money market account—and a risky asset—the S&P 500 index. The risk-free rate of return is modelled using a three-factor Vasicek (1977) term structure model in the spirit of Babbs and Nowman (1999), whereas the risky asset is modelled using an affine continuous-time two-factor stochastic volatility model that extends the double Heston model of Christoffersen et al. (2009) by allowing for jumps.
[3] This method is effective, but other approaches could also be successful, such as the autoregressive conditional heteroscedasticity (ARCH) model by Engle (1982), the generalized ARCH (GARCH) model by Bollerslev (1986), and exponentially weighted moving average models.
[4] The term funnel of doubt, introduced by Redington (1952), refers to a figure showing the dispersion of a given process. Typically, the figure shows the average and some percentiles of the process.


